
Model establishment and simulation plan
To investigate the drawing law of different top coal thicknesses under GDMs, based on the coal–rock occurrence conditions of the 8222 working face, a numerical drawing test model along the inclination of the working face using the particle flow code (PFC) software (https://www.itascacg.com/software/pfc) was established (Fig. 6). The entire model had a length and height of 66.2 and 27.4 m, respectively. The model mining height was 4.0 m, the top coal thickness was set 4 gradients (Table 1), and the immediate roof thickness was 7.4 m. The left side of the model was a machine roadway, with dimensions of 5.6 × 3.4 m2 (width × height), with an air roadway on the right, whose dimensions were 4.6 × 3.4 m2 (width × height). A total of 32 fully mechanized drawing supports were set between the model machine and air roadways, including 8 transition supports (no coal drawing) and 24 middle coal drawing supports (coal drawing). The center distance of the support was 1.75 m. To simulate coal and rock blocks more realistically, on-site images of the coal–rock blocks at the coal drawing support and sampling of the coal gangue blocks at the working face were collected to extract the boundary curves of the coal–rock blocks. After rotating and stacking the boundaries of the coal–rock blocks, we found that the top coal and rock blocks mostly had irregular polygonal shapes in two-dimensional space. Therefore, irregular blocks were used to simulate the broken top coal and immediate roof (Fig. 7). The simulated block size of the 8222 working face was set according to the measured block size30 (Table 2). Notably, the upper- and lower-top coals in Table 2 are within a 2-m range above and below the coal body. The other parts of the coal body are the middle–top coal. The degree distribution of the crushed immediate roof block is consistent with that of the upper-top coal. The displacement constraint boundary was applied on both sides and the bottom of the model, and the “wall” element in PFC was used to limit the coal–rock block movement. The top of the model was a free boundary without an external force, implying that the coal–rock block was only affected by its gravity and the gravity on the upper block.
Figure 6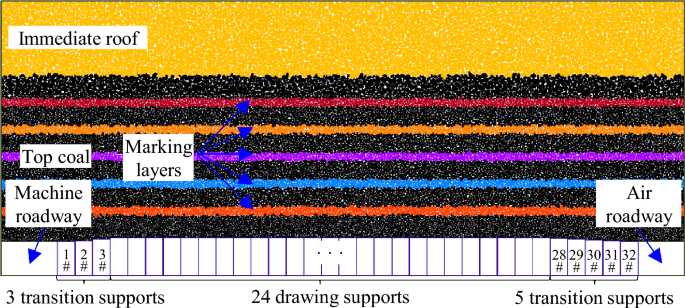
Numerical coal drawing test model for working face inclination (top coal thickness of 16 m).
Table 1 Coal drawing experiment scheme for different top coal thicknesses. Figure 7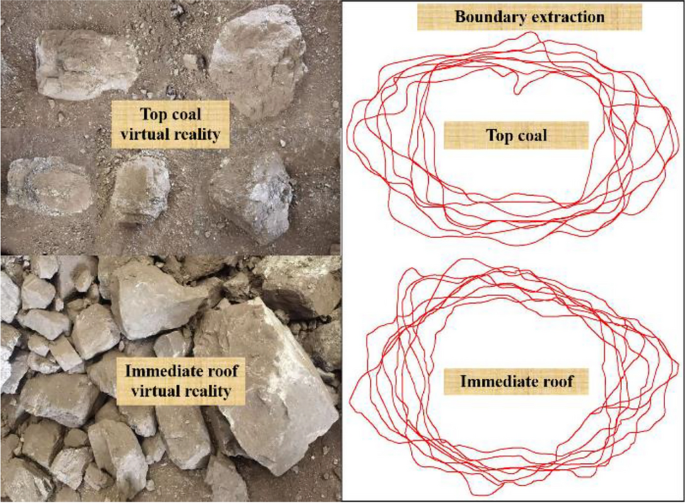
Actual morphology and boundary extraction of fractured coal and rock.
Table 2 Model physical and contact mechanic parameters.
The collapse angle of the top coal in the 3–5 # coal seam is generally within 75°–85°. Because of the undeveloped cracks in the top coal above the two roadways of the working face and the influence of support materials, such as anchors, the collapse is relatively difficult. Therefore, the lower value of the top coal collapse angle above the two roadways is set to 75°, and the immediate roof collapse angle is set to 90°. Before drawing coal, we first removed the working face supports to simulate the collapse and accumulation of the top coal after the support removal and then applied displacement constraints to the top coal and immediate roof above the roadways to simulate the top coal and roof collapse (Fig. 8).
Figure 8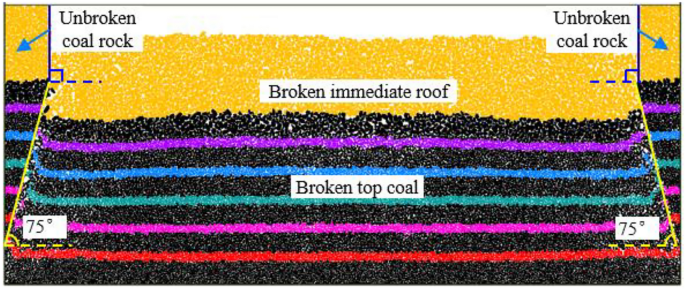
Top coal and immediate roof collapse and piling after support movement.
After the model stabilized, drawing tests using different drawing methods and top coal thicknesses were performed according to the sequence of support coal drawings shown in Table 1. During on-site coal drawing, workers generally determine the timing of closing the drawing by observing the volume proportion of gangue on the coal flow surface of the rear scraper conveyor. Therefore, coal workers actually use IGC as a judgment indicator to determine whether to terminate the coal drawing. In this case, the GC observed by workers is instantaneous and dynamic and will constantly change with an increase in drawn coal. When the coal drawing termination criterion of “closing the drawing opening upon seeing the gangue” is adopted in the working face, there is a worker’s reaction time and support action time during the process from observing the gangue appearance on the scraper conveyor to controlling the support to close the drawing opening. Inevitably, a certain amount of gangue will still be mixed in the drawn top coal. However, numerical simulation can monitor whether the gangue has reached the drawing opening at a very high frequency. If the “closing the drawing opening upon seeing the gangue” is still used as the termination condition for the coal drawing, there will be a considerable difference between the numerical simulation and the actual situation. Therefore, we considered a 10% IGC as the threshold to simulate the “closing the drawing opening upon seeing the gangue” coal drawing termination criterion in actual production.
After the experiment, the amount and time of coal drawing for different top coal thicknesses and the number of drawing openings were calculated, and the TCR and drawing efficiency were then calculated. Normally, the transition supports at both ends of the working face do not draw coal, and only a portion of the top coal above them can be drawn when coal is drawn through adjacent supports. In this case, the TCR statistics of the entire model cannot truly reflect the actual recovery situation of the top coal along the working face inclination. Therefore, statistical analysis was performed on the TCR situation in the actual drawing area of the model, and the TCR was determined. ηdip can be obtained using Eq. (15):
$$eta_{{{text{dip}}}} = frac{{w_{d} }}{{w_{t} }} times 100%$$
(15)
where wd denotes the mass of top coal drawn in the drawing area (the amount of top coal drawn from 4–28# supports), and wt denotes the mass of all top coals in the drawing area of the initial model (the initial amount of top coal above 4–28# supports). As the name suggests, drawing efficiency is the mass of top coal drawn per unit time.
Top coal recovery and drawing efficiency
To analyze the relation between the TCR and the number of drawing openings, the TCR of the entire drawing area was calculated (Fig. 9). For top coal thicknesses of 4 and 8 m, the TCR gradually increases with an increase in the number of drawing openings, whereas for top coal thicknesses of 12 and 16 m, the TCR gradually decreases with an increase in the number of drawing openings. Specifically, for the top coal thicknesses of 4 and 8 m, the TCR values of the two-opening GDM were 85.68% and 86.00%, respectively. Compared with the two-opening GDM, the TCR of the three (four)-opening GDM increased by 0.15% (3.25%) and 2.26% (3.60%), respectively. For the top coal thicknesses of 12 and 16 m, the TCR values of the two-opening GDM were 90.34% and 92.28%, respectively. Compared with the two-opening GDM, the TCR values of the three (four)-opening GDM decreased by 1.12% (3.51%) and 0.37% (1.65%), respectively. As a result, TCR depends on drawing time or efficiency as well as the number of drawing openings.
Figure 9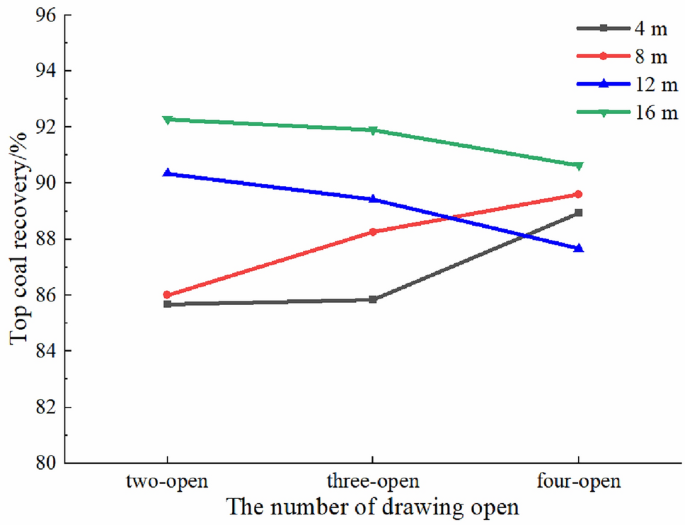
Top coal recovery in the drawing area using the single-round group drawing method.
Figure 10 shows the drawing time and efficiency for different top coal thicknesses. As shown in the figure, for the same top coal thickness, as the number of drawing openings increases, the drawing time gradually decreases and the drawing efficiency gradually increases. This is because increasing the number of drawing openings can reduce the number of simulated drawing times, thereby reducing the drawing time and increasing the drawing efficiency. Notably, when the number of drawing openings is greater than or equal to 2, the top coal no longer arches during drawing, which also reduces the drawing time to a certain extent. In addition, as the top coal thickness increases, the influence of the number of drawing openings on the drawing time and efficiency becomes more notable. Considering the top coal thicknesses of 4 and 16 m as examples, when the top coal thickness was 4 m, the number of drawing opens increased from 2 to 4, the drawing efficiency was 5.66%, 9.21% and 13.14% respectively, and the coal drawing time was 33.6 s, 20.3 s and 14.7 s respectively. Compared with the two-opening GDM, the three-opening GDM’s time reduced by 39.58% and efficiency increased by 62.72%, whereas the four-opening GDM’s time reduced by 56.25% and efficiency increased by 131.45%; when the top coal thickness was 16 m, the number of drawing opens increased from 2 to 4, the drawing efficiency was 10.66%, 19.78% and 31.04%, and the drawing time was 79.07 s, 41.65 s and 26.32 s, respectively. Compared with the two-opening GDM, the three-opening GDM’s time reduced by 47.32% and efficiency increased by 85.61%, whereas the four-opening GDM’s time reduced by 66.71% and efficiency increased by 191.20%. Notably, the two-dimensional model cannot correspond to the actual drawing time and efficiency on-site; the simulation results here are only used for horizontal trend comparison analysis.
Figure 10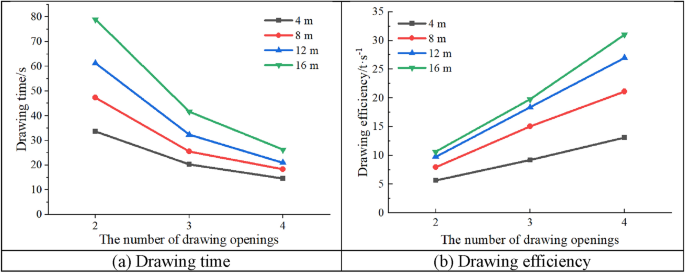
Time and efficiency under the single-round group drawing method.
Top coal loss analysis
Based on the above analysis, it can be concluded that TCR decreases with increasing top coal thickness. To investigate the top coal loss, the identification (ID) numbers of the top coal blocks drawn in each group of tests were extracted and recorded, and the blocks were deleted in the initial model. The blank area formed is the original spatial position of the top coal drawn, and the remaining top coal is the top coal that has not been drawn, which is the original spatial position of the lost top coal (Fig. 11).
Figure 11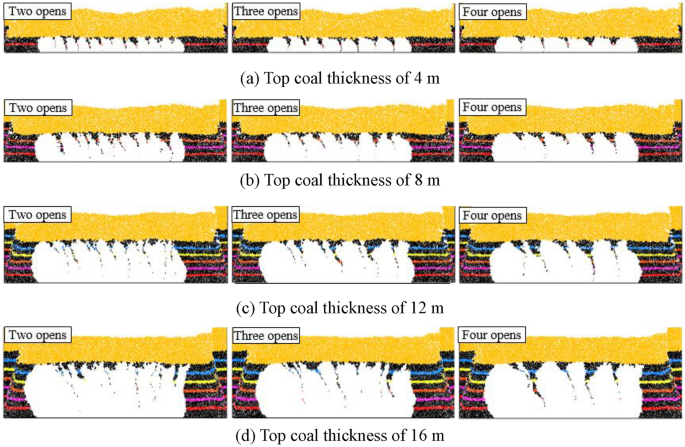
Original spatial position of the loss top coal under the single-round group drawing method.
As shown in Fig. 11, in the initial model, the shape of the lost top coal is roughly the shape of a “nail rake,” and the direction of the “rake teeth” is biased toward the direction of the model’s coal drawn (air roadway direction). The amount of top coal loss increases with the top coal layer, and the amount of top coal loss in the upper part is substantially greater than that in the lower part. In addition, for the same number of drawing openings, as the top coal thickness increases, the “rake teeth” shape becomes wider, indicating that an increase in the top coal thickness increases the top coal loss. As the number of coal drawing openings increases, the “rake teeth” become sparser, but the “rake teeth” volume gradually increases. This means that an increase in the number of drawing openings can, on the one hand, reduce the frequency of top coal loss, but, on the other hand, cause an increase in the amount of single top coal loss. That is, the impact of the number of drawing openings on the amount of top coal loss is influenced by both the drawing frequency of coal and the amount of single top coal loss, resulting in uncertainty in the direct impact of the number of drawing openings on the top coal loss.
(1) Analysis of top coal loss in different layers.
To further analyze the top coal loss in different layers, a thickness layer of 1 m was used to calculate the top coal loss in each layer for different numbers of drawing openings and top coal thicknesses (Fig. 12). As the top coal thickness increases, the lower-top coal loss rate decreases, but the upper-top coal loss rate continues to increase. Considering the two-opening GDM as an example, while increasing the top coal thickness from 4 to 16 m, the top coal loss rate within the top-1-m range increased from 42.23 to 61.38%, indicating that the thicker the top coal, the more difficult it is to recover the upper coal. In addition, for top coal thicknesses of 4 and 8 m, the increase in the number of drawing openings decreases the top coal loss rate at different layers, and the higher the top coal layer, the greater the decrease in the loss rate. This indicates that the increase in the number of drawing openings is conducive to reducing the top coal loss rate, thereby achieving the goal of improving the TCR. However, for top coal thicknesses of 12 and 16 m, the top coal loss at different layers is exactly the opposite for different numbers of drawing openings.
Figure 12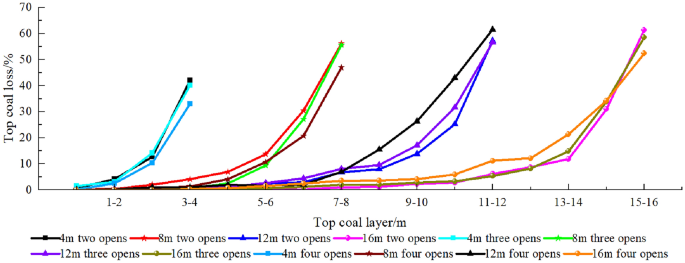
Loss rate of top coal at different layers under the single-round group drawing method.
In summary, there is a notable thickness effect of the number of drawing openings on the top coal loss. When the top coal thickness is ≤ 8 m, an increase in the number of drawing openings reduces the top coal loss in each layer. However, when the top coal thickness is > 8 m, an increase in the number of drawing openings increases the top coal loss in each layer. This is consistent with the relation between the TCR and the number of drawing openings under different top coal thicknesses.
(2) Impact mechanism of the number of drawing openings on top coal loss.
From the above analysis, the influence of the number of drawing openings on TCR has a top coal thickness effect. When the top coal thickness is small, the TCR increases with the number of drawing openings. When the top coal thickness is large, the TCR decreases with an increase in the number of drawing openings. To analyze the impact mechanism of the number of drawing openings on the top coal loss, considering the two- or four-opening GDM for top coal thicknesses of 4 and 16 m as examples, representative drawing times were selected to analyze the formation process of top coal loss. We extracted and recorded the ID numbers of the top coal blocks drawn for the nth time in each group of tests and deleted these blocks from the model after completion of the (n − 1)th coal drawing. The blank area formed is the top coal drawing body, DBn.
Figure 13 shows the formation process of top coal loss for a single-round GDM with a top coal thickness of 4 m. When the top coal thickness is small, the distance between the coal–rock interface on the side of the drawing openings and the drawing openings is relatively small. The development height of the top coal drawing body is equal to the top coal thickness, and its lateral development degree reaches the limit level as the top coal thickness becomes constant. However, at the same development height, its lateral development degree gradually decreases with an increase in the number of drawing openings, and the top coal loss generated through single drawing also gradually increases. Nevertheless, an increase in the number of drawing openings can reduce the frequency of top coal loss, and its impact on the amount of top coal loss is dominant, thereby making the total amount of top coal loss gradually decrease with increasing number of drawing openings.
Figure 13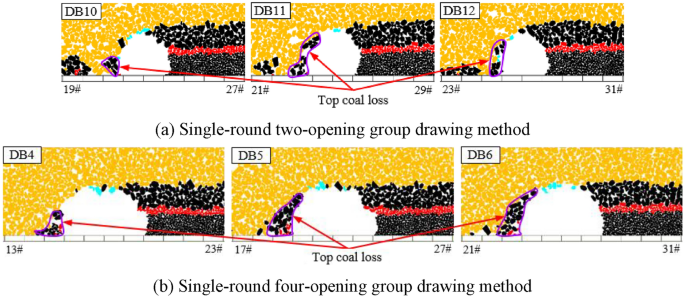
Top coal loss formation process under single-round group drawing method with a top coal thickness of 4 m.
Figure 14 shows the formation process of top coal loss for a single-round GDM with a top coal thickness of 16 m. When the top coal thickness is substantial, the distance between the coal–rock interface on the side of the drawing openings and the drawing openings is relatively far. The development height of the top coal drawing body is much lower than the top coal thickness, resulting in a low degree of lateral development. Accordingly, the top coal drawing body and coal–rock interface are mostly point-like and tangent, and numerous top coal that are difficult to draw below the tangent point exist, leading to a significant amount of top coal loss. As the number of drawing openings increases, the lateral development degree of the top coal drawing body continuously decreases, thereby considerably enhancing the top coal loss generated through a single drawing. This loss dominates the total loss of top coal, thereby gradually increasing the total amount of top coal loss with the increasing number of drawing openings.
Figure 14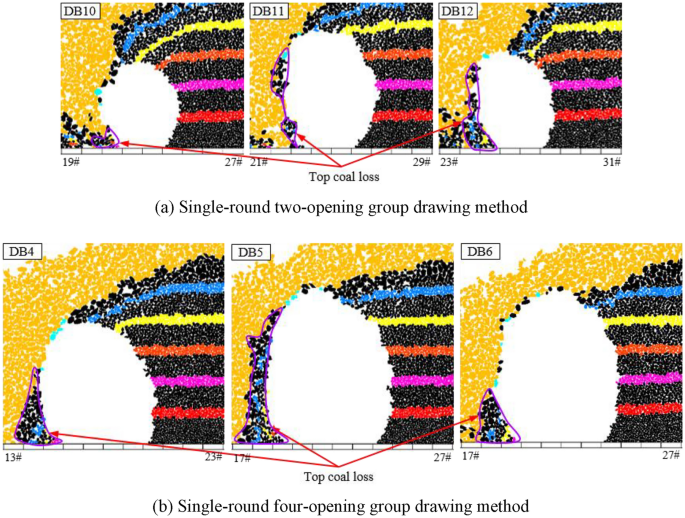
Top coal loss formation process under single-round group drawing method with a top coal thickness of 16 m.
Relation between top coal recovery and gangue content
To reveal the relation between TCR and GC for single-round GDM, the IGC (volume proportion of gangue) at the drawing opening was calculated using a rectangular monitoring window during drawing (Fig. 15). When the IGC exceeds a set threshold, a “wall” structure element is instantly created at the drawing openings to simulate its closure. Notably, as the coal seam thickness increases, the range of immediate roof fragmentation rock block flow increases. However, an excessive drawing may result in the roof being very empty, which is not allowed in actual mining production. Accordingly, the maximum IGC thresholds in the top coal thickness schemes of 4, 8, 12, and 16 m were set to 80%, 70%, 60%, and 50%, respectively (Table 3).
Figure 15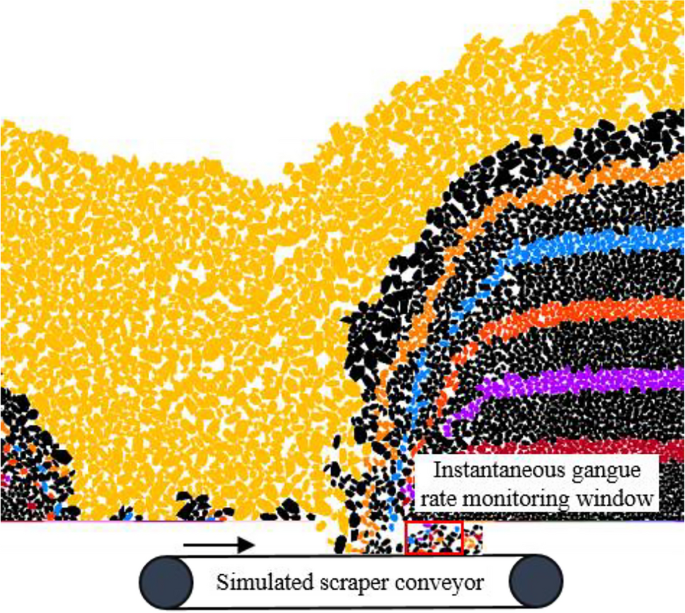
Schematic of instantaneous gangue content monitoring with support opening.
Table 3 Experimental scheme of the group drawing method under different thresholds of instantaneous gangue content (IGC).
CGC was obtained by calculating the proportion of gangue quality at the drawing openings. Figure 16 shows the relation between TCR with different thicknesses and CGC. TCR with GDM for different top coal thicknesses increases with CGC, but the trend gradually declines. TCR and CGC are correlated with a negative exponential relation (with a goodness of fit of > 0.87). When CGC is small, there is a considerable difference in the TCR values of the two-, three-, and four-opening GDMs. As CGC increases, the TCR values of the two-, three-, and four-opening GDMs gradually tend to be consistent, indicating that in the early stage of gangue formation, the coal drawn is mainly the top coal. By drawing an appropriate amount of gangue, TCR can be greatly improved. In the later stage of gangue formation, the amount of top coal drawn gradually decreases, whereas the amount of gangue gradually increases. At this time, it is difficult to recover more top coals by drawing the gangue. Moreover, TCR still increases with the number of drawing openings when the top coal thickness is 4 m. For a top coal thickness of 8 m, when CGC is low (< 13%), TCR increases with the number of drawing openings. However, when CGC is high (≥ 13%), the advantage of the TCR of the two-opening GDM begins to emerge. With the same CGC, the TCR of the two-opening GDM is greater than that of the three- or four-opening GDM. For top coal thicknesses of 12 and 16 m, TCR decreases with the increasing number of drawing openings. However, overall, for top coal thicknesses of 4 and 8 m, the TCR of the four-opening GDM is more advantageous (Fig. 16a,b), whereas, for top coal thicknesses of 12 and 16 m, the TCR of the two-opening GDM is the highest (Fig. 16c,d). This also indicates that when the top coal thickness is large (> 8 m), the fewer drawing openings opened simultaneously, the better the effect of the top coal drawn.
Figure 16
Relation between top coal recovery and cumulative gangue content for different top coal thicknesses.
In addition, as shown in Fig. 16, with an increase in top coal thickness, the effect of increasing CGC on the TCR rate gradually weakens, and the limit value of TCR gradually decreases with increasing top coal thickness. This means that as the top coal thickness increases, the effect of increasing CGC on the TCR improvement is limited; the TCR improvement has already been completed when CGC is small. Therefore, when the top coal thickness is large, a relatively good TCR can be achieved with a lower CGC.
Figure 17 shows the relation between the CGC and IGC thresholds for different top coal thicknesses. CGC increases with the IGC threshold, and the growth rate continues to increase. They have a quadratic relation, with a goodness of fit of > 0.96, indicating that it is completely feasible to use the IGC threshold at the drawing openings to infer CGC, which also provides a basis for determining the timing of closing the openings in the working face. In addition, when the IGC threshold is small, there is not much difference in CGC among the two-, three-, and four-opening GDMs. However, as the IGC threshold increases, the difference in CGC among them gradually increases. This is because the IGC at the opening is the proportion of gangue volume, but CGC is the proportion of mass, and the coal gangue density substantially varies (gangue density can reach approximately 1.8 times the coal density). Therefore, as the IGC threshold increases, the CGC growth rate increases.
Figure 17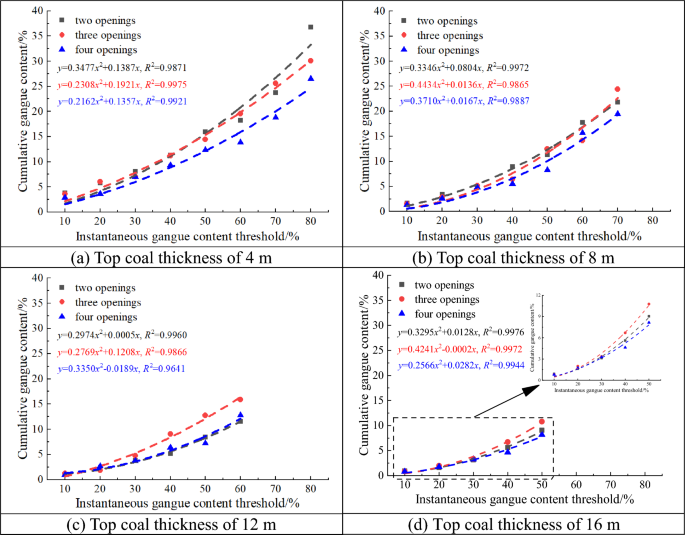
Relation between cumulative gangue content and instantaneous gangue content threshold for different top coal thicknesses.
In addition, as shown in Fig. 17, as the top coal thickness gradually increases, the CGC growth rate continues to de-accelerate. With the same IGC threshold, the thicker the top coal, the lower the CGC, and the lower the coal washing or sorting costs caused by the appropriate gangue drawing. This is beneficial for some fully mechanized working faces with thick top coal. Considering the two-opening GDM as an example, at an IGC threshold of 30%, CGC decreased from 7.07 to 3.33% when the top coal thickness was increased from 4 to 16 m.
In summary, for top coal thicknesses of 4 and 8 m, it is advisable to use the four-opening group drawing technology. Meanwhile, for top coal thicknesses of 12 and 16 m, it is advisable to use the two-opening group drawing technology. Without considering the increase in coal washing or sorting costs caused by excessive coal drawing, from the perspective of improving TCR, with a growth rate of less than 10% as the boundary, CGC should be greater than 21% and 14%, respectively, for top coal thicknesses of 4 and 8 m, and greater than 11% and 6%, respectively, for top coal thicknesses of 12 and 16 m. From the perspective of setting the IGC threshold at the drawing opening, for top coal thicknesses of 4 and 8 m, the IGC threshold for the four-opening GDM should be set to approximately 70% and 60%, respectively; meanwhile, for top coal thicknesses of 12 and 16 m, the IGC threshold for the two-opening GDM should be set to approximately 50% and 40%, respectively.
According to the theoretical analysis, it can be seen that there is a quantitative relationship between the CGC, the IGC and the TCR, but the theoretical analysis only gives the specific expression of the IGC and the CGC. To establish the quantitative relationship between the GC and the TCR, this paper uses the numerical simulation method to fit the relationship curve between the CGC and the TCR under the two-opening GDM. It is found that when the CGC is about 10%, the TCR no longer increases with the increase of the CGC. Then, the CGC of 10% is brought into the theoretical analysis to obtain the relationship between the IGC and the CGC, and the theoretical value of the IGC corresponding to the coal drawing openings is 31.2%. Therefore, the integrated utilization of theoretical analysis and numerical simulation has led to the determination that the reasonable threshold of IGC at the coal drawing openings of the 8222 working face in Tashan Mine lies between 31.2 and 40%.